Dashboard: the flying day at a glance
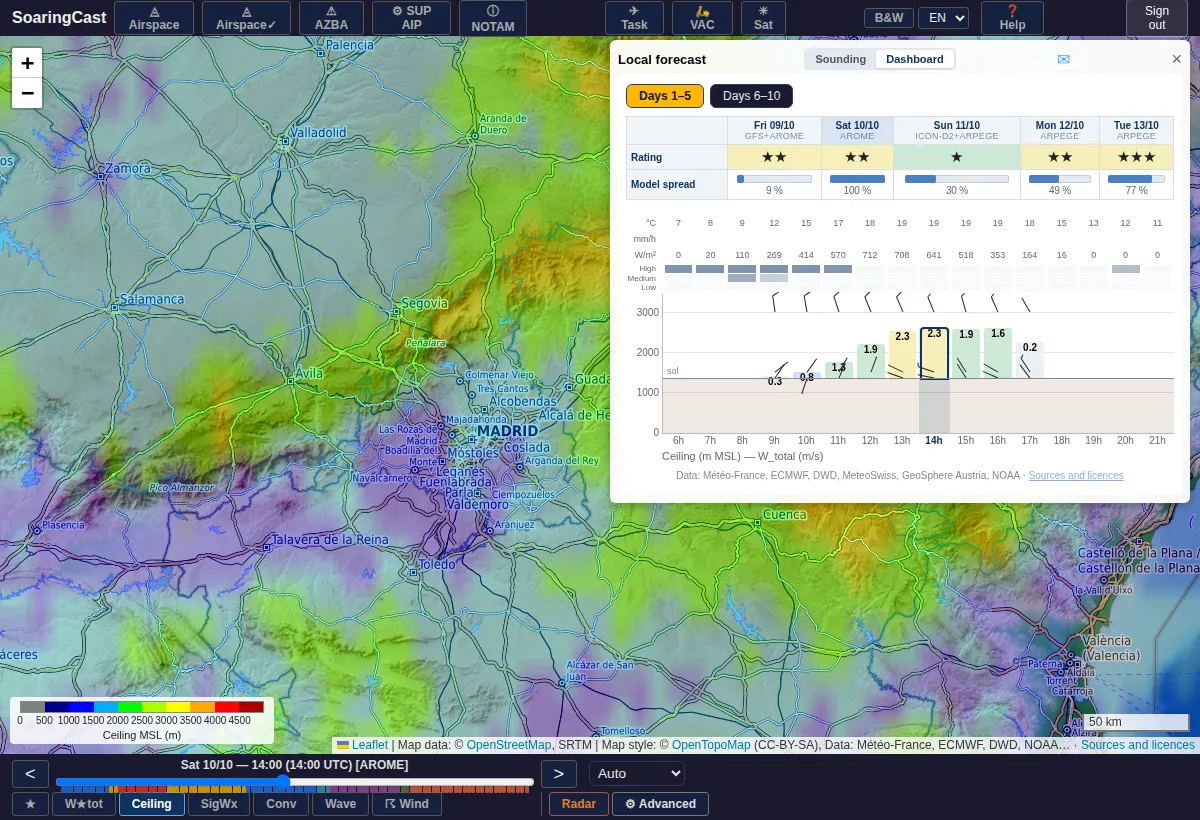
Dashboard
The second tab sums up ten days at the clicked point. The « Days 1–5 » and « 6–10 » buttons switch pages. Clicking a day shows it hour by hour; clicking an hour moves the map cursor there.
- Bars: the usable height above ground, topped with a cumulus when there are any; the value shown is the total lift.
- Top bands: low, mid and high cloud.
- Temperature, rain, solar radiation and wind at 850 hPa (~1,500 m).
- ★ rating: the quality of the day, from 0 to 5. It takes into account duration, thermal strength, ceiling and wind. It is a summary and does not replace a detailed reading.
Model spread
Below the rating, a gauge shows how much the models disagree about the day. At 0 %, they forecast the same day and the rating is solid. At 100 %, they describe completely different days. It is a disagreement index, not a probability: a good rating with a large spread deserves another look at the next update. Hover over the cell for details.
Dashboard by e-mail
The ✉ button in the dashboard e-mails you the dashboard for a location, at each model update you tick. The estimated delivery time is shown next to each box. You can create up to three subscriptions. An e-mail is only sent once the forecast is complete.
The site's e-mails (account creation, password, dashboard) come from soaringcast.com. If you do not receive them, check your spam folder.
Create an account to access the map, soundings and the dashboard.
Create an account