Sounding (skew-T) and point values
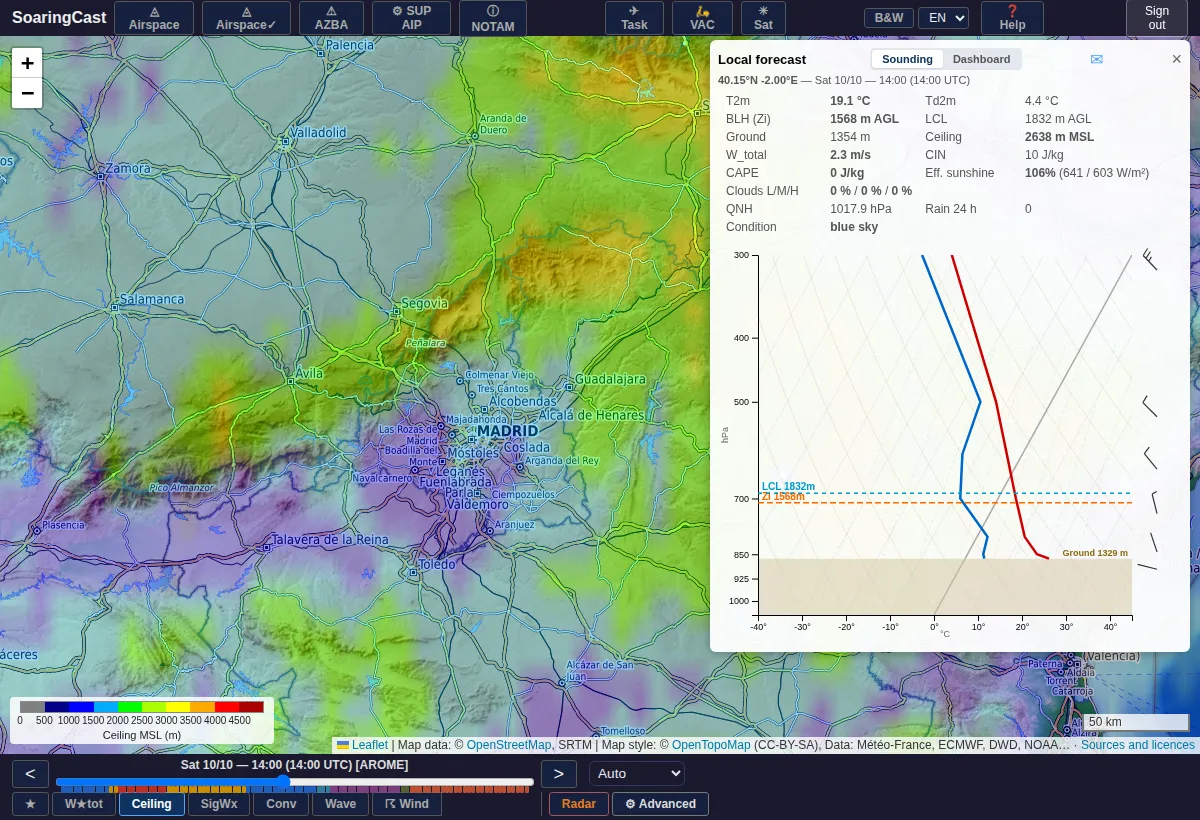
A click opens the panel for that point, updated as you move the cursor. It has two tabs: Sounding and Dashboard.
Sounding
The vertical profile of the atmosphere at the clicked point: temperature (red), dew point (blue), wind by level (barbs), top of thermals (green line) and cumulus base (blue line).
Values at the point
| Value | Meaning |
|---|---|
| T2m, Td2m | Temperature and dew point at 2 m |
| BLH, LCL | Top of thermals and cumulus base, above ground |
| Ground | Terrain elevation |
| Ceiling | Reachable altitude, above mean sea level |
| W★tot | Total lift, as on the W★tot map |
| CAPE, CIN | Instability, and the « lid » that holds back triggering |
| Eff. sunshine | Share of sunshine reaching the ground compared with a clear sky |
| Clouds L/M/H | Low, mid and high cloud cover |
| QNH | Pressure at mean sea level |
| Rain 24 h | Total over the previous 24 hours |
Nearest station observation
When the cursor is close to the current time, a blue bubble gives the latest reading from the nearest Météo-France station. The colour of the temperature difference shows whether the model matches reality: green, in line; yellow, slight difference; red, clear difference, to take into account.
Create an account to access the map, soundings and the dashboard.
Create an account