Soaring weather maps: cloud base, thermals, convergence, wave
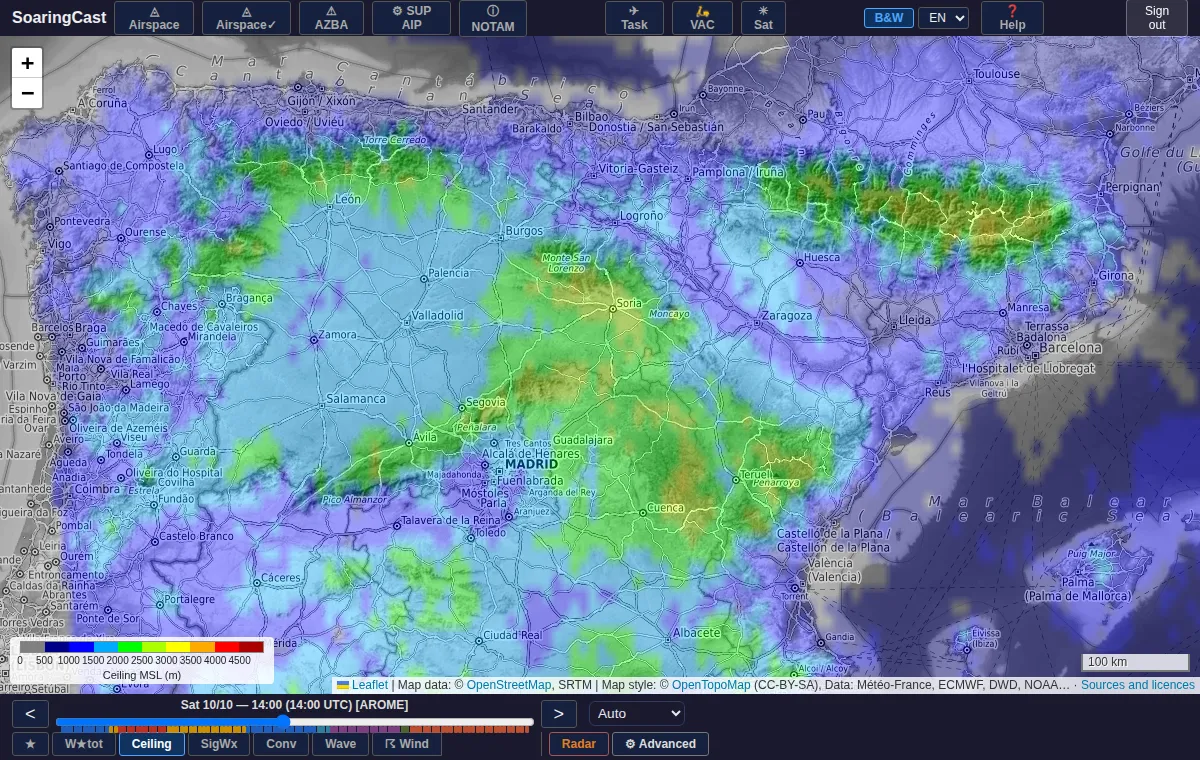
Weather maps
The bottom bar holds the everyday maps: ★, W★tot, Ceiling, SigWx, Conv, Wave, Wind and Radar. The others are in the ⚙ Advanced menu.
★ — Day rating
A 0 to 5 star rating of the soaring day, anywhere on the map. A first pass to know where to look.
Ceiling
How high you can expect to climb, above mean sea level: it compares directly with an altimeter set to QNH. It is the cumulus base when there are cumulus, otherwise the usable top of blue thermals.
W★tot — Total lift
The strength of the lift, all sources together: thermals, ridge, wave and convergence. It is the speed of the air, not the glider's vario (subtract the glider's sink rate).
Reading: < 1 m/s weak, 1-2 m/s usable, 2-3 m/s good, > 3 m/s excellent.
Caution: strong wave aloft is enough to colour the map, even when thermals are weak near the ground. Before concluding, compare with the Ceiling and Wave maps.
SigWx — Significant weather
The expected convective weather, as pictograms. The layer overlays the selected map: it is switched on and off independently, like the wind.
| Pictogram | Meaning |
|---|---|
| flat cumulus | Developing cumulus |
| white cloud | Cumulus |
| large grey cloud | Overdevelopment |
| grey cloud + rain | Showers |
| dark cloud + lightning | Thunderstorm |
| faint altocumulus, cirrus | Mid-level cloud or high veil, which can shut down thermals |
No pictogram: blue sky, or no convection. A very isolated shower may not show up: for rain, check the Radar.
Conv — Convergence
Areas where winds meet and lift the air: sea-breeze fronts, valley convergence, air-mass boundaries.
| Colour | Meaning |
|---|---|
| Green → yellow → orange | Stronger and stronger convergence: possible lift |
| Mauve → purple | Divergence: sinking air, to avoid |
| Transparent | Neutral |
Wave
The forecast vertical motion of the air aloft: red for lift, blue for sink (rotors). The selector picks the level:
| Level | Approx. altitude | For |
|---|---|---|
| 850 hPa | ~1,500 m | Medium ranges (Jura, Vosges, Massif Central) |
| 700 hPa | ~3,000 m | Alps, Pyrenees |
| 500 hPa | ~5,500 m | Large-amplitude wave |
Wave is only available with AROME, up to about D+1.
« Advanced » menu
The ⚙ Advanced button opens the secondary maps; when one of them is shown, its name appears on the button.
| Map | What it shows |
|---|---|
| W* | The strength of thermals alone |
| W★rlf | What the terrain adds: sunny slopes, wind on ridges; negative over deep valleys |
| BLH | The depth of the layer stirred by thermals, above ground |
| LCL | The theoretical cumulus base, above ground |
| Cu/Blue | Grey: no convection; sky blue: blue thermals; white: cumulus; red: overdevelopment |
| CAPE | Instability: the higher it is, the more violent convection can be (thunderstorms) |
| Cloud, Low, Mid, High | Total cloud cover and cover per layer |
| Snow | Snow cover observed by satellite |
| Gusts | Surface wind gusts forecast for the next few hours |
| Geol, Drain. | Rock types, and how fast the ground dries after rain |
Wind
The Wind button animates the wind on top of any map. The selector picks the level: 10 m AGL, 850 hPa (~1,500 m), 700 hPa (~3,000 m) or 500 hPa (~5,500 m). Isobars are drawn at the same time.
The B&W button, at the top, turns the base map black and white so the colours stand out. It switches on by itself on the Conv and Wave maps.
Radar and satellite
Radar
A single time scale for rain: observed rain from the Météo-France radars over the last hour, the nowcast for the next six hours, then the model forecast up to D+10 (beyond D+2, it is a trend). When you press the button, the cursor jumps to the latest observation.
Satellite
The ☀ Sat button shows the latest Meteosat images and moves the cursor to the current time, so you can compare the forecast with what is happening. The selector offers several views:
- visible, natural colour, day and night;
- cloud type, fog and stratus (useful in the morning);
- infrared, lightning;
- dust, fires and snow.
Create an account to access the map, soundings and the dashboard.
Create an account